Minnova Corp. Issues an Updated Preliminary Economic Assessment for its Maverick Gold Project
Toronto, Ontario - Minnova Corp. (TSXV: MCI, (“Minnova” of “the Company”) is pleased to announce it has filed its Updated Preliminary Economic Assessment (“PEA”) Technical Report titled “NI 43-101 UPDATED PRELIMINARY ECONOMIC ASSESSMENT OPEN PIT AND UNDERGROUND MINING, AND ON-SITE MILLING AT THE MAVERICK GOLD PROJECT, INCLUDING MINING OF THE PL GOLD DEPOSIT AND THE NOKOMIS GOLD DEPOSIT, Sherridan, Manitoba” on SEDAR at www.sedar.com. The Updated PEA was prepared by ACA Howe International Limited (“Howe”) based on the mineral resource estimates (see April 17, 2014 news release) prepared by P&E Mining Consultants Inc. and Howe on Minnova’s 100% owned Maverick Gold Project. Prior to June 2014 Minnova was called Auriga Gold Corp. (“Auriga Gold”). Prior to this release the PL Property and PL Mine were known as the Puffy Lake Property and Puffy Lake Mine. Currencies reported below are in Canadian dollars unless otherwise specified.
Highlights from the Base Case study, which uses a long term gold price of US$1,250 per ounce gold and USD:CAD exchange rate of $1.05, include:
- Pre-tax Net Present Value (“NPV”) at a 5% discount rate of $97.7 million and an Internal Rate of Return (“IRR”) of 59%;
- After-tax NPV at a 5% discount rate of $83.3 million and IRR of 55%;
- After-tax payback of 1.5 years after plant start-up;
- 11 year mine life, mining and processing 2.5 million tonnes, averaging 6.53 grams per tonne (“g/t”) gold, and producing 483,000 ounces of gold;
- Open pit production amounts to 558,000 tonnes at an average diluted grade of 4.41 g/t gold at a LOM strip ratio of 6:1;
- Underground production amounts to 1.98 million tonnes an average diluted grade of 7.26 g/t gold;
- Total payable gold production of 483,000 ounces with an average Life of Mine (“LOM”) cash cost of US$798 per ounce and average AISC of US$1003 per ounce;
- Years 2 to 5 mill feed planned at 900 tpd to produce an average of 52,522 ounces a year at an average cash cost of US$849 per ounce and average AISC of US$991 per ounce;
- Years 6 to 10 mill throughput planned at 600 tpd to produce an average of 49,100 ounces a year at cash cost of US$770 per ounce and AISC of US$896 per ounce;
- Pre-production (years -1 and 1) capital cost of $26.3 million including a 19% for contingency, environmental bonds and initial working capital;
- In Year 1, the projected $12.7 million capital expenditure is partially offset by income of $6.6 million;
- Sustaining Capital and Closure Costs of $29.5 million over LOM;
Gorden Glenn, President & CEO of Minnova commented, “We are very pleased with the results of this Updated Preliminary Economic Assessment. It confirms the Maverick Gold Project (“MGP”) as a robust project with a low pre-production capital cost, low operating and All In Sustaining Cost’s (“AISC”) and a quick payback of 1.5 years from the start of production on a +10 year mine life.
Our focus on upgrading the PL and Nokomis resources (see our April 17, 2014 press release) and introducing new innovative underground mining techniques to the mine plan have resulted in a higher overall life of mine gold production, higher average annual production, lower cash operating costs, lower AISC and lower strip ratio over our initial January 2012 Preliminary Economic Assessment (“January 2012 PEA”).
Importantly the project’s NPV has remained largely unchanged despite using a lower, more conservative, long-term gold price of US$1,250/oz vs $1,400/oz used in the January 2012 PEA. While the initial capital costs have increased modestly they are more defensible incorporating significant contingency, environmental permitting and bonding, and working capital considerations, which were not fully factored into the January 2012 PEA. The completion of this updated PEA marks another significant milestone for Minnova and we can now move forward with our plans for a test underground stope program to validate the SAMSTM underground mining method, finalize and update all required operating permits and complete a Feasibility Study by the end of 2014. Upon completion of the Feasibility Study we anticipate we could be initiating construction/rehabilitation of the mine and mill infrastructure in early 2015 toward achieving initial production in the second half of 2015.”
UPDATED MAVERICK GOLD PROJECT DEVELOPMENT PLAN
The Maverick Gold Project updated development plan includes the following:
Pre-production Year -1 (starts July 1, 2014)
- Starting in complete an initial underground test mining program at the PL underground mine;
- Finalize all environmental and operating permits
- By the end of 2014 complete a Feasibility Study (“FS”)
Development and Production Years 1 - 11 (starts July 1, 2015)
- Assuming positive FS, starting in January 2015 initiate the refurbishment and reactivation of the existing PL mill and underground mine;
- Sequential development of five open pits on the PL Deposit and another on the Nokomis Deposit;
Closure and Rehabilitation
- Progressive mine closure activity and planning;
- Mine closure in year 11 to be followed by and a post-closure monitoring program.
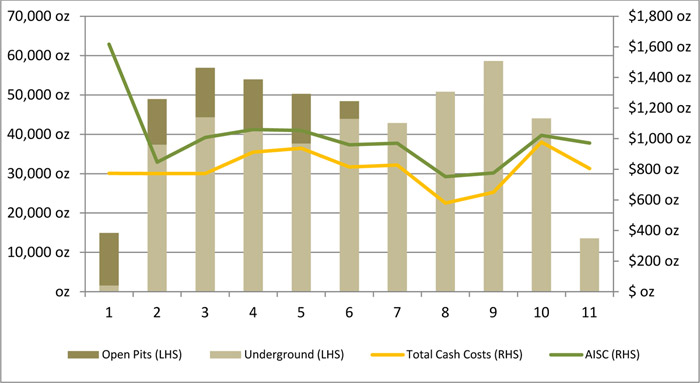
Forecast Gold Production
Howe estimates total mill feed to be 2.53 million tonnes at an average diluted grade of 6.58g/t. Of this approximately 1.98 million tonnes at an average diluted grade of 7.26 g/t would be sourced from underground mine on the PL deposit and 0.59 million tonnes would be sourced from shallow open pits at an average diluted grade of 4.17 g/t Au.
At full production from open pits and underground (900 tpd) in years 2 through 5 average annual production is estimated at approximately 52,500 ounces and will drop to an average of 49,000 ounces during years 6 through 10 when the pits are depleted (underground only) and mill throughput drops to 600tpd. Years 1 and 11 are partial years.
Total recoverable gold production over the LOM is estimated at 483,000 ounces for an average annual production rate of approximately 48,100 ounces of gold. The project development schedule is shown in Figure 1.
Figure 1: Summary of Projected Annual Gold Production, Cash Operating Costs and AISC
Preliminary Economic Assessment
The Maverick Gold Project was assessed using a discounted cashflow approach with a Base Case long-term gold price of US$1,250/oz and a USD:CAD exchange rate of 1.05.
The results of the economic analysis, summarized in Table 1 and Table 2, support advancing the project and completing a FS by the end of 2014. Undiscounted after-tax cashflow amounts to $125.7 million and returns a robust IRR of 55%.
Table1: Results of the Economic Analysis
|
IRR |
Pre-tax |
After-tax |
|---|---|---|
| Undiscounted NPV ($M) |
$146.20 |
$125.70 |
| NPV (5%) ($M) |
$97.70 |
$83.80 |
| NPV (8%) ($M) |
$77.50 |
$66.40 |
| Payback |
3 yrs from start of development |
Table 2: Results of the Cashflow Analysis
|
Undiscounted |
Discounted at |
Discounted at |
IRR (%) |
|
|---|---|---|---|---|
| Gross Sales |
$629,632 |
$475,868 |
$408,206 |
|
| Less royalties |
$18,291 |
$13,785 |
$11,807 |
|
| Less selling expenses |
$2,900 |
$2,191 |
$1,880 |
|
| Net Sales Revenue |
$608,441 |
$459,890 |
$394,519 |
|
| Mining costs |
$306,573 |
$221,457 |
$185,021 |
|
| Processing costs |
$67,399 |
$48,613 |
$40,602 |
|
| G&A costs |
$32,461 |
$23,311 |
$19,424 |
|
| Total cash operating costs |
$406,434 |
$293,381 |
$245,048 |
|
| Net cash operating margin |
$202,006 |
$144,609 |
$120,247 |
|
| Initial capital |
$26,299 |
$24,471 |
$23,481 |
|
| Sustaining capital |
$29,504 |
$24,722 |
$22,430 |
|
| Net cash flow before tax |
$146,203 |
$97,713 |
$77,535 |
59% |
| Taxation payable |
$20,463 |
$13,845 |
$11,103 |
|
| Net cash flow after tax |
$125,739 |
$83,867 |
$66,432 |
55% |
Resources
Together the PL and Nokomis gold deposits support mineral resources amenable to open pit and underground mining that include Measured and Indicated mineral resources totalling 327,900 ounces of gold and Inferred mineral resources of 438,600 ounces of gold. See mineral resource summary in Table 3 and Table 4 below.
Table 3: PL Deposit Mineral Resource Estimate as of April 17, 2014
|
Class |
Au Cut-off g/t |
Tonnes |
Au g/t |
Contained Au oz |
|
|---|---|---|---|---|---|
| In-Pit | Measured |
0.6 |
123,000 |
4.41 |
17,400 |
| Indicated |
0.6 |
445,000 |
4.40 |
63,000 |
|
| M+I |
0.6 |
568,000 |
4.40 |
80,400 |
|
| Inferred |
0.6 |
45,000 |
4.87 |
7,000 |
|
| Out-of-Pit | Measured |
2.5 |
27,000 |
5.12 |
4,500 |
| Indicated |
2.5 |
1,057,000 |
5.95 |
202,300 |
|
| M+I |
2.5 |
1,084,000 |
5.93 |
206,800 |
|
| Inferred |
2.5 |
2,135,000 |
6.01 |
412,500 |
|
| Total | Measured |
0.6/2.5 |
150,000 |
4.54 |
21,900 |
| Indicated |
0.6/2.5 |
1,502,000 |
5.49 |
265,300 |
|
| M+I |
0.6/2.5 |
1,652,000 |
5.41 |
287,200 |
|
| Inferred |
0.6/2.5 |
2,180,000 |
5.99 |
419,500 |
Notes PL Deposit:
- The volume of the historical mined areas was depleted from the resource estimate.
Table 4: Nokomis Mineral Resource Estimate Statement as of April 17, 2014
|
Class |
Reporting |
Tonnes |
Grade g/t Au |
Contained Au oz |
|---|---|---|---|---|
|
Indicated |
0.6 |
371,000 |
3.41 |
41,000 |
|
Inferred |
0.6 |
247,000 |
2.41 |
19,000 |
Notes PL and Nokomis Deposits:
- The quantity and grade of reported Inferred resources in this estimation are uncertain in nature and there has been insufficient exploration to define these Inferred resources as an Indicated or Measured mineral resource and it is uncertain if further exploration will result in upgrading them to an Indicated or Measured mineral resource category.
- The PL updated NI 43-101 compliant mineral resource estimate has been prepared by Mr. Eugene Puritch, P.Eng. of P&E Mining Consultants Inc.. The Nokomis NI 43-101 compliant mineral resource was prepared by Leon McGarry, B.Sc., P.Geo., of ACA Howe International Limited.
- The NI 43-101 compliant mineral resources in this press release were estimated using the Canadian Institute of Mining, Metallurgy and Petroleum (CIM), CIM Standards on Mineral Resources and Reserves, Definitions and Guidelines prepared by the CIM Standing Committee on Reserve Definitions and adopted by CIM Council.
- Grade capping of 30g/t Au was utilized on composites at the PL Deposit and grade capping of 50g/t Au was utilized on raw assays at the Nokomis Deposit.
- Bulk densities of 2.72 t/m3 and 2.89t/m3, respectively were used for tonnage calculations at the PL Deposit and Nokomis Deposits, respectively.
- At the PL gold deposit open pit resources are reported within an optimized pit shell.
- A gold price of US$1,300/oz and an exchange rate of US$0.97US=C$1.00 was utilized in the Au cut-off grade calculations of 0.6 g/t open pit and 2.5 g/t underground. Open pit mining costs were C$3.75/t for mineralized material and C$3.00/t for waste rock while underground mining costs were C$75/t. Process costs were C$17/t and G&A was C$6/t. Process recovery used was 95%.
- Tonnes and ounces have been rounded to reflect the relative accuracy of the mineral resource estimate; therefore numbers may not total correctly.
- Mineral Resource tonnes quoted are not diluted.
- Mineral resources are not mineral reserves and by definition do not demonstrate economic viability. This mineral resource estimate includes inferred mineral resources that are normally considered too speculative geologically to have economic considerations applied to them that would enable them to be categorized as mineral reserves. There is also no certainty that these inferred mineral resources will be converted to the measured and indicated resource categories through further drilling, or into mineral reserves, once economic considerations are applied.
- 1 troy ounce equals 31.10348 grams.
Mining Model Construction
The mine plan developed for the Updated PEA considers the re-opening of the PL underground mine and the development of five new open pits on the PL gold property and another on the Nokomis gold property.
The relative contribution of open pit and underground feed to the mill has been optimized to so as to generate the highest value early in the mine life. This is done to accelerate capital payback and maximize cash flow and hence deliver the highest Net Present Value. The defining variables used for this work are summarized in Table 5 and Table 6 below.
Table 5: Parameters used to create the financial model for the Maverick Gold Project (PL and Nokomis Gold Deposits)
|
Parameter |
Unit |
Values |
|---|---|---|
| Au price |
US$/oz |
1,250 |
| Exchange rate |
USD:CAD |
1.05 |
| Au recovery |
% |
90 |
| Au payable |
% |
99 |
| Selling costs (Au refining, transportation and insurance) |
US$/payable oz |
6 |
Table 6: Maverick Gold Project Estimated Unit Operating Costs
|
Item |
Unit Operating Costs |
|---|---|
| Open pit mining costs: | |
| Mining cost | $7.50 / t potentially economic mineralization |
| Definition drilling and grade control assays | $3.00 / t potentially economic mineralization |
| Overburden Stripping | $1.88 / t overburden |
| Waste rock stripping cost | $6.00 / t waste rock |
| Muskeg removal allowance | $2.0 M |
| Underground development and mining costs: | |
| Typical lateral development cost | $5,100 / m for drift and ramp development |
| Production stoping cost | $50.00 / t potentially economic mineralization |
| Underground mine indirect operating costs | $38.00 / t potentially economic mineralization |
| Underground haul to mill | $2.00 / t potentially economic mineralization |
| Processing cost | yrs 1-5; $22.24 /t, yr 6; $26.00 /t, yrs 7-11: $29.79 /t processed |
| Tailings management cost | yrs 1-5; $1.00 /t, yr 6; $1.27 /t, yrs 7-11: $1.50 /t processed |
| General and Administration cost | yrs 1-5; $10.51 /t, yr 6; $13.34 /t, yrs 7-11: $15.77 /t processed |
| Production royalties | 3% at PL deposit, 2% at Nokomis deposit (2.92% overall) |
| Projected corporate taxes | 15% federal & 10% provincial. |
Figure 2: Image showing the PL deposit open pits 1 through 5 and underground block model.
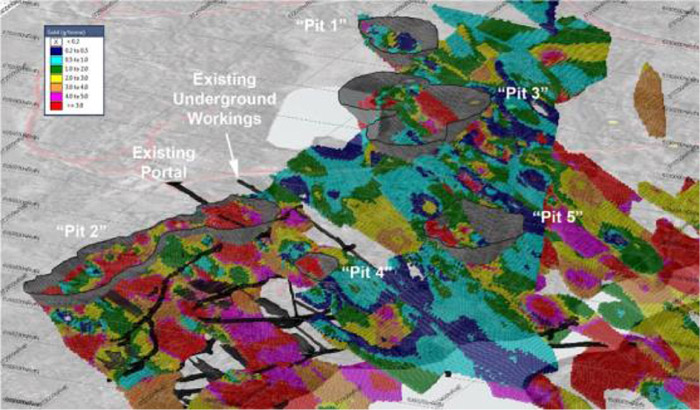
Open pit mining would be done using conventional open pit equipment and technologies. Underground mining would be done using Minrail Inc.’s Shallow Angle Mining System (SAMSTM) which would first be demonstrated in a test stope. The SAMSTM is designed to underground mine flat dipping zones. It uses back-mounted rails and suspended interchangeable drilling, blasting and mucking modules. Stopes would paste backfilled once mined out.
The mines would operate 350 days/year on a two 10 hour shifts per day basis with four rotating crews. The mill would operate on a two 12 hour shifts per day basis with four rotating crews.
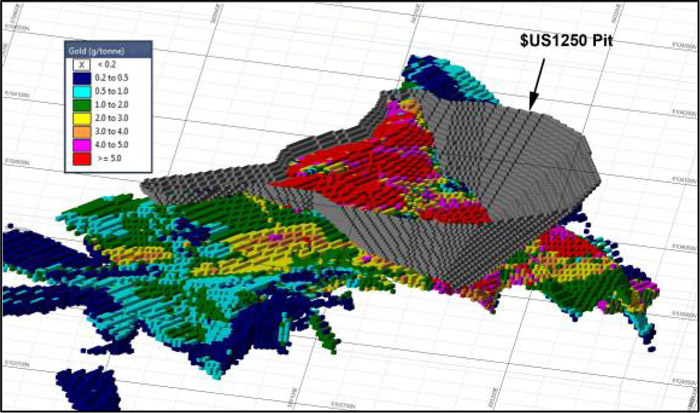
The Nokomis satellite deposit, located less than 8 kilometres to the northeast, will be incorporated into the mine plan in year 3 enabling mill feed to be sustained at 900tpd for years 2 through 5. In years 6 through 11 mine output will consist of underground mineralization only and the mill feed rate will drop to 600tpd.
Figure 3: Nokomis pit, facing east-northeast
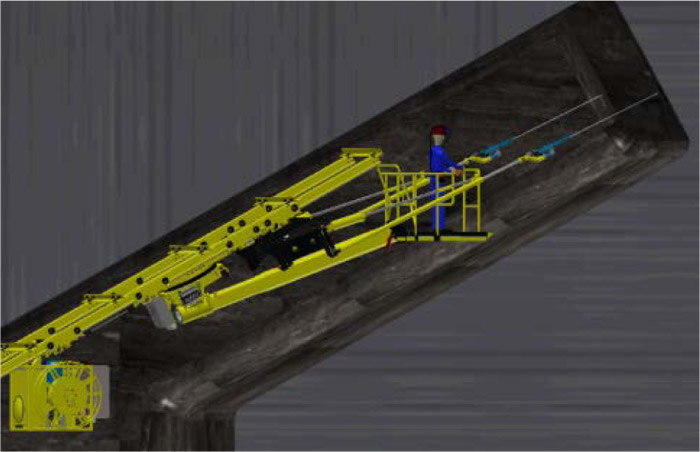
SAMSTM represents an innovated new technology that is designed to ensure and enhance operator safety while improving productivity. The electric-powered modules have multiple braking systems including a failsafe braking system. Minrail has reviewed its safety devices with mine safety regulators in Ontario and Quebec and reports that the SAMSTM system meets rigorous mine safety requirements in those jurisdictions. The proposed test stoping program at the PL underground mine would be reviewed with Manitoba health and safety regulatory authorities prior to the test.
Figure 4: Driving the stope centre raise using SAMSTM
Processing
The existing process plant has a name plate capacity of 1,000 tonnes per day and has been on care and maintenance since April 1989. It is proposed to rehabilitate and use the existing PL mill for processing. It is anticipated that, although process modifications and equipment additions may be indicated by future testwork, the historical flowsheet will be satisfactory.
The initial throughput rate for this study is 900 t/d which will yield a nominal grind (K80) of approximately 110 microns utilizing the existing conventional crushing and grinding circuits. Based on planned tonnage and grade and assuming continuous stable operation, an overall gold recovery of 90% is projected. This recovery estimate would be confirmed by testwork on samples representing the current mining plan.
Infrastructure
The Maverick Gold Project is accessible by all-weather road and there is a commercial rail line within 7 kilometers for the property for delivery of bulk supplies. Power would be provided Manitoba Hydro which requires modest extensions and upgrades of existing transmission lines to the site. A back-up power supply would be provided from diesel generators already located at site. Manitoba Hydro is a reliable, low cost source of power.
As described in the Updated PEA report Minnova plan to conduct a fish population survey of the Ragged TMA this summer. This PEA assumes that the Ragged TMA would continue to be utilized for tailings management.
Capital Costs
The initial capital requirement in years -1 and 1 for the Project is estimated to be US$26.3M, as detailed in Table 7. This amount includes 19% for contingency, environmental bonds and initial working capital. Year 1, the projected $12.7 million capital expenditure is partially offset by income of $6.6 million.
Table 7: Maverick Gold Project Pre-production Capital Cost Estimate as of July 9, 2014
| Item | Pre-production ($k) |
Production ($k) |
Total ($k) |
||
|---|---|---|---|---|---|
| Yr -1 | Yr 1 | Yrs 2-11 | |||
| Months 1-12 | Months 1-7 |
Months 8-12 |
Months 13 - EML | ||
|
Mill running |
—————–> | ||||
| Test stoping |
$4,342 |
$4,342 |
|||
| Feasibility study and supporting studies |
$415 |
$415 |
|||
| Mill rehabilitation and commissioning |
$6,245 |
$3,898 |
$280 |
$10,423 |
|
| Infrastructure |
$1,550 |
$475 |
$2,999 |
$5,024 |
|
| Underground mine |
$3,390 |
$0 |
$15,575 |
$18,965 |
|
| Paste backfill plant |
$5,000 |
$5,000 |
|||
| Open Pits including muskeg removal |
$314 |
$2,250 |
$2,564 |
||
| Environmental projects |
$540 |
$100 |
$0 |
$100 |
$740 |
| Mine closure |
$500 |
$0 |
$5,300 |
$5,800 |
|
| Working Capital |
$2,000 |
-$2,000 |
$0 |
||
| Sub Total |
$13,092 |
$8,677 |
$2,000 |
$29,504 |
$53,273 |
| Contingency |
$530 |
$2,000 |
$2,530 |
||
| Total |
$13,622 |
$12,677 |
$29,504 |
$55,803 |
|
|
Cumulative Capital |
$13,622 |
$26,299 |
$55,803 |
|
|
The Project has a total sustaining capital requirement of $29.5M. Closure costs amount to $5.8M. Start-up capital contingency plus closure bond and working capital amounts to $4.5M.
Financial Analysis and Sensitivities
Using a gold price of $1,250/oz, the study yields a pre-tax NPV8% of $77.5 million and IRR of 59%. After-tax NPV8% amounts to $66.4 million and an IRR of 55%. The results of the sensitivity analysis for the Base Case are shown in Table 8 and indicate that the project is most sensitive to changes in gold price and head grade, and least sensitive to changes in capital cost.
It must be noted that all economic results reported in a PEA are preliminary in nature and as such may vary considerably from actual results. The project does not currently have any mineral reserves as the declaration of reserves requires at least a pre-feasibility study to be completed.
Table 8: Results of Sensitivity Analysis of the Base Case
| Parameter |
After-Tax NPV (8%)� ($M) |
||||||||
|---|---|---|---|---|---|---|---|---|---|
|
-40% |
-30% |
-20% |
-10% |
0% |
10% |
20% |
30% |
40% |
|
|
Head Grade |
-$43 |
-$16 |
$12 |
$39 |
$66 |
$94 |
$121 |
$149 |
$176 |
|
Gold Price |
-$44 |
-$16 |
$11 |
$39 |
$66 |
$94 |
$122 |
$149 |
$177 |
|
Operating Costs |
$140 |
$122 |
$103 |
$85 |
$66 |
$48 |
$30 |
$11 |
-$7 |
|
Capital Costs |
$77 |
$74 |
$72 |
$69 |
$66 |
$64 |
$61 |
$59 |
$56 |
Qualified Persons
The PEA was conducted under the overall review of David Orava, M. Eng., P. Eng. of ACA Howe International Ltd. of Toronto Ontario with the following Qualified Persons contributing to their respective sections:
| Alfred Hayden | P.Eng., Senior Associate Metallurgical Engineer, ACA Howe International Ltd. | |
| David Burga | P.Geo., Geologist, P&E Mining Consultants Inc. | |
| Eugene Puritch | P.Eng., President, P&E Mining Consultants Inc. | |
| Felix Lee | P.Geo., Senior Geologist, ACA Howe International Ltd. | |
| Leon McGarry | P.Geo., Project Geologist, ACA Howe International Ltd. | |
|
William Douglas Roy, M.A.Sc. |
P.Eng., Senior Associate Mining Engineer, ACA Howe International Ltd. | |
| Yungang Wu | P.Geo., Geologist, P&E Mining Consultants Inc. |
The foregoing Qualified Persons have verified that the data from the PEA is fairly and accurately disclosed in this news release.
About Minnova Corp.
Minnova Corp. is an emerging Canadian gold producer focused on re-starting the PL Mine and expanding gold resources on its PL and Nokomis gold deposits (collectively the “Maverick Gold Project”). The Company has completed an Updated PEA which supports average annual production of 48,100 ounces over a +10 year mine life. Work to date strongly supports advancing the project toward production with an initial program of underground test mining and completion of a Feasibility Study to bring the PL Mine back into production. The PL Mine includes a 1,000 tpd flotation mill with a replacement value in excess of $50 million, over 7,000 meters of developed underground ramp to 135 metres depth, is fully road accessible and close to existing mining infrastructure. The Maverick Gold Project is located in the Flin Flon Greenstone Belt of Central Manitoba. To view current images of the property and mill, please see www.minnovacorp.ca/s/photogallery.asp
For more information please contact:
| Minnova Corp. Gorden Glenn Chairman, President and CEO gglenn@minnovacorp.ca Phone: +1 (647) 985 2785 info@minnovacorp.ca http://www.minnovacorp.ca |
CHF Investor Relations Cathy Hume CEO Tel: +1 (416) 868 1079 ext.231 Email: cathy@chfir.com www.chfir.com |
Renmark Financial Communications Inc. Barry Mire: bmire@renmarkfinancial.com Laurence A. Lachance: llachance@renmarkfinancial.com Tel.: +1 (416) 644 2020 or +1 (514) 939 3989 www.renmarkfinancial.com |
This news release contains “forward-looking information” within the meaning of applicable Canadian securities legislation. Forward-looking information includes, but is not limited to, information regarding the Company including management’s assessment of future plans and operations, that may involve risks associated with mining exploration and development, volatility of prices, currency fluctuations, imprecision of resource estimates, environmental and permitting risks, access to labour and services, competition from other companies and ability to access sufficient capital. As a consequence, actual results may differ materially from those anticipated in the forward looking statements. A feasibility study has not been completed and there is no certainty the disclosed targets will be achieved nor that the proposed operations will be economically viable. Although Auriga Gold has attempted to identify important factors that could cause actual results to differ materially from those contained in forward-looking information, there may be other factors that cause results not to be as anticipated, estimated or intended. There can be no assurance that such information will prove to be accurate, as actual results and future events could differ materially from those anticipated in such information. Accordingly, readers should not place undue reliance on forward-looking information. Auriga Gold does not undertake to update any forward-looking information, except in accordance with applicable securities laws.
Neither TSX Venture Exchange nor its Regulation Services Provider (as that term is defined in the policies of the TSX Venture Exchange) accepts responsibility for the adequacy or accuracy of this release.